In the second assignment of the LSDE (Large Scale data Engineering) course, student teams have access to a largish Hadoop cluster at SurfSara, and are given a (big) dataset to analyze a particular question.
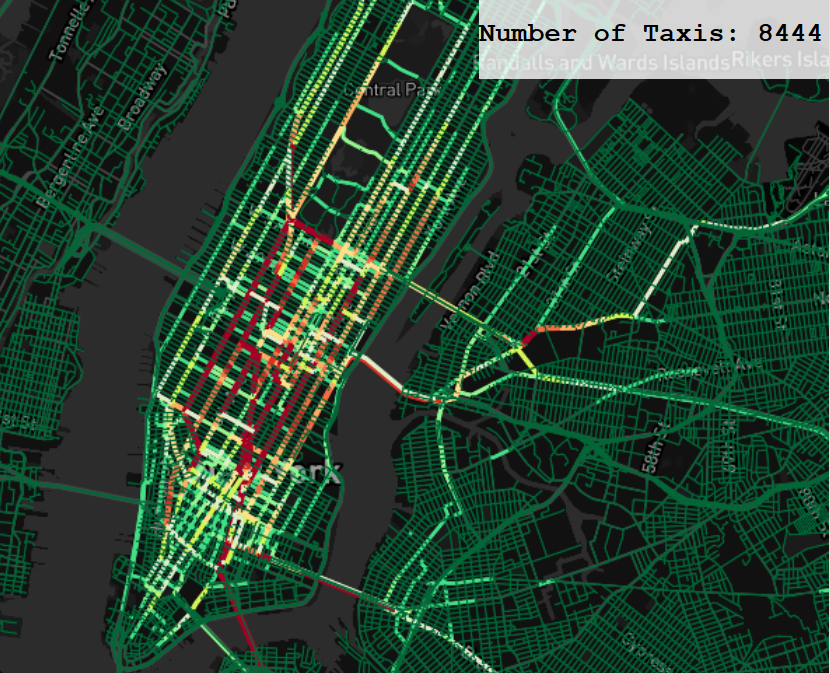
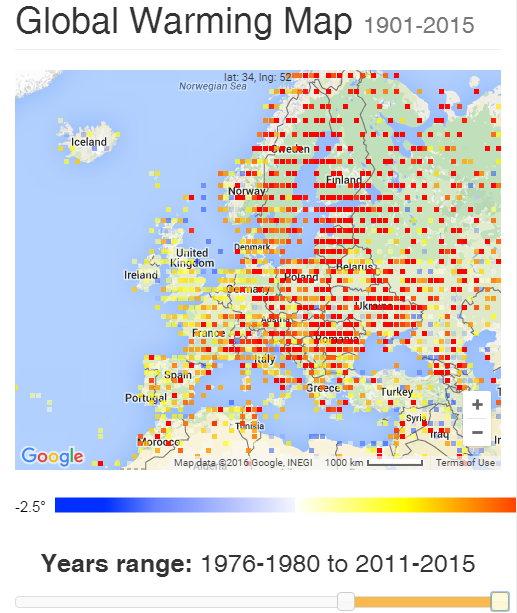
The students had to write a (graded) report, as well as create a visualization.
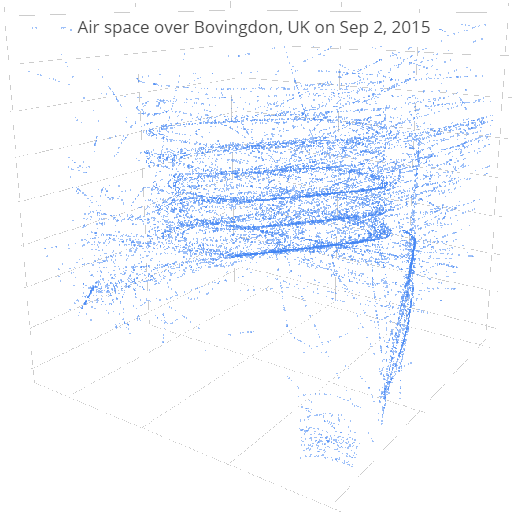
Generally speaking, we are impressed by the results of our students. Some of the visualizations are just very cool. What better way to explain how pilots are made to wait in the sky for a landing in a virtual multi-level car-park, while flying holding patterns (click on the image below for the 3-d visualization made by Alexander Renz-Wieland).
Please check out the various project results, by clicking in the menu on the right. There are obviously mistakes here and there (e.g. read here to understand that the $600K earning taxi-driver is a data error) but for projects that need to be performed in four weeks as a first confrontation with cluster computing, we consider these results pretty good.
Maybe you will join us as a student in LSDE 2017?


